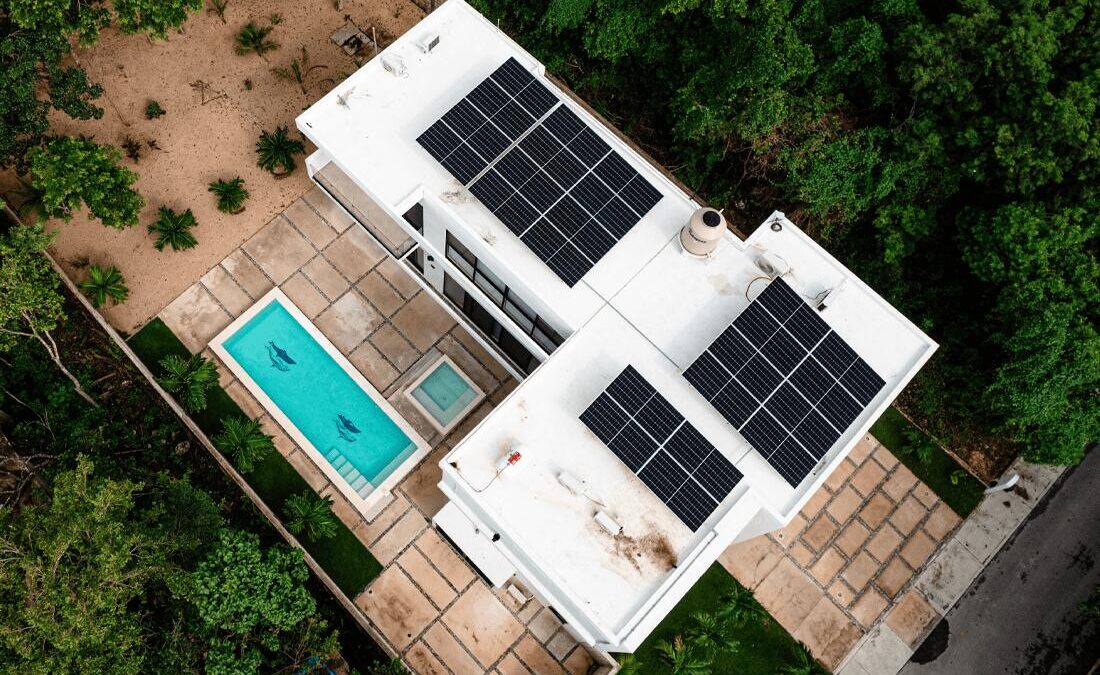
Mexico distributed generation solar investment 2026, Digi Mart USA News: Mexico has accumulated an investment of 14,582.53 million dollars in distributed generation, linked to installed capacity of 5,675.47 megawatts (MW), according to first-half 2026 figures from the National Energy Commission (CNE). Solar technology accounts for 99.5 percent of that capacity.
According to the interconnection request report, Mexico has processed 655,417 distributed generation applications. This modality allows electricity to be produced at installations close to points of consumption.
Solar photovoltaic energy dominates the segment, with 5,649.34 MW and an estimated investment of 14,456.66 million dollars.
Other technologies have a smaller share. Biogas adds 20.5 MW, with a calculated value of 105.66 million dollars.
Biomass reaches 3.11 MW and 16.03 million dollars, while cogeneration registers 1.36 MW and 1.81 million dollars.
Growth in this modality is also reflected in the number of applications. Between 2017 and 2025, applications increased at an average annual rate of 40.49 percent, while capacity advanced at a rate of 40.95 percent.
The report notes that these indicators do not yet incorporate the full behavior of 2026.
By state, Jalisco has the largest number of processed applications, with 107,285, equivalent to 16.37 percent of the total, and a capacity of 808.58 MW, or 14.25 percent. Nuevo Leon ranks second, with 75,933 applications and 596.22 MW, followed by Chihuahua, with 53,935 applications and 424.85 MW.
Together, these three states account for about 36 percent of applications and 32.24 percent of cumulative distributed generation capacity in the country.
By regional distribution, the West concentrates the largest number of applications, with 191,793, equivalent to 29.27 percent of the total. However, the North-Bajio region registers the largest capacity, with 1,436.09 MW, followed by the West with 1,422.43 MW, Center-East with 1,411.95 MW, and the Northwest with 1,405 MW.
Net metering accounts for most distributed generation applications, with 648,260 applications and a capacity of 5,596.65 MW. Within this modality, systems of up to 50 kilowatts (kW) represent 98.23 percent of applications, with 636,775 applications, though they contribute 63.57 percent of capacity, equivalent to 3,557.98 MW.
By contrast, installations between 250 and 500 kW total just 2,600 applications, or 0.40 percent of the net metering total, but account for 1,081.98 MW, or 19.33 percent of that scheme’s capacity.
Net billing registers 6,649 applications and 75.04 MW of capacity. In this modality, systems of up to 50 kW represent 97.23 percent of applications.
The full sale scheme has a much smaller share, with 508 applications and a cumulative capacity of 3.78 MW.